
Contents
- The Big Sur Paradox: Why Intervention Outperforms Resignation
- The Challenge: A Coastal Ecosystem Under Siege
- The Solution: Strategic Monitoring and Localized Action
- The Results: Ecological Cascades and Canopy Survival
- Next Steps: Applying the Big Sur Blueprint to Your Land
The Big Sur Paradox: Why Intervention Outperforms Resignation
Key Takeaway: Across a decade of monitoring in Big Sur (2011 through 2021), groves that received early, targeted bay laurel removal retained measurable canopy density where neighboring unmanaged stands collapsed. Proactive management preserved forest structure. Passive observation documented its loss.
There is a fatalism that settles over land managers the moment Phytophthora ramorum shows up in a coastal watershed. The assumption runs deep: once Sudden Oak Death enters a dense redwood-tanoak system, total canopy collapse is only a matter of time. Resignation feels like the rational response.
Big Sur tells a more complicated story.
The research coalition working these ridges faced a genuine fork early on. One camp argued for purely observational plots — document the decline honestly, build a clean dataset, accept the ecosystem's trajectory. The other pushed for active management zones. After the first spatial models suggested the pathogen's spread was patchier and more corridor-dependent than expected, the coalition committed to intervention. Canopy density retention was then tracked through biennial aerial LiDAR scans across the full monitoring window.
The contrarian position that emerged is straightforward. Strategic, localized action in early-stage invasion zones does not merely slow the disease. It actively preserves core forest structure in ways that observation alone never could. The arrival of SOD is not a death sentence for a whole region. It is a starting gun for triage.
The Challenge: A Coastal Ecosystem Under Siege
Big Sur's woodlands are not a single forest so much as a layered relationship. Coastal redwoods form the towering overstory, while tanoaks fill the mid-canopy and understory, feeding wildlife and stabilizing steep slopes. The two species share the same fog-fed, mild-temperature environment — and that shared environment is exactly what made the region so vulnerable.
When the Phytophthora ramorum pathogen arrived, the transformation was fast and visible. Tanoak crowns browned in patches, then in swaths. Bleeding cankers appeared on trunks. What had been a continuous green canopy from ridge to ravine developed the mottled, dying texture that field crews learned to spot from a single vantage point.
Why the fog belt became an incubator
The disease ecology here is unusually specific. Phytophthora ramorum sporulates most aggressively in a narrow band, roughly 15 to 20 degrees Celsius, and it needs sustained moisture — about 48 to 72 hours of continuous leaf wetness during spring rain events, to complete its cycle. Big Sur delivers both with cruel reliability.
Field teams prioritized mapping along the coastal ridges where the marine layer inversion traps moisture against the slopes. Those specific microclimates behaved as the primary incubators. The fog does not just dampen the leaves; it holds them wet through the exact window the pathogen requires.
Pro Tip: Variation in sporulation rates tracks closely with localized fog drip accumulation and marine layer inversion. When you map risk on your own land, treat fog-catching ridgelines and gullies as hotter zones than open, wind-dried slopes.
Dense, continuous canopies compounded the problem. With crowns touching across the watershed, spores moved from infected bay laurel to susceptible oak with almost no gaps to slow them.
The Solution: Strategic Monitoring and Localized Action
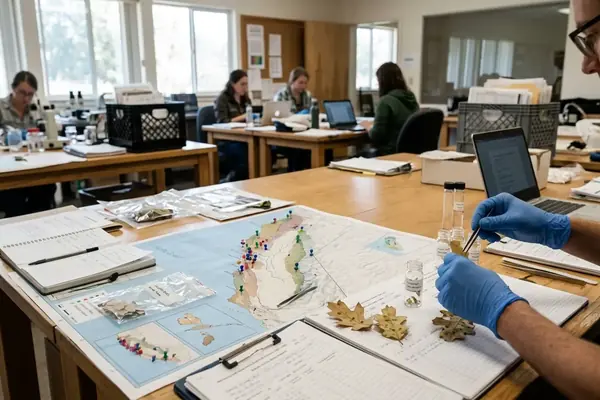
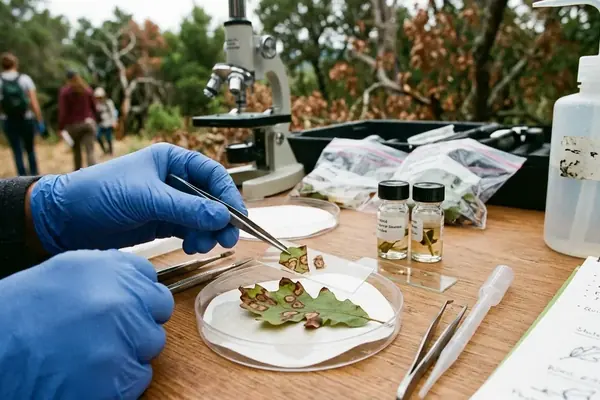
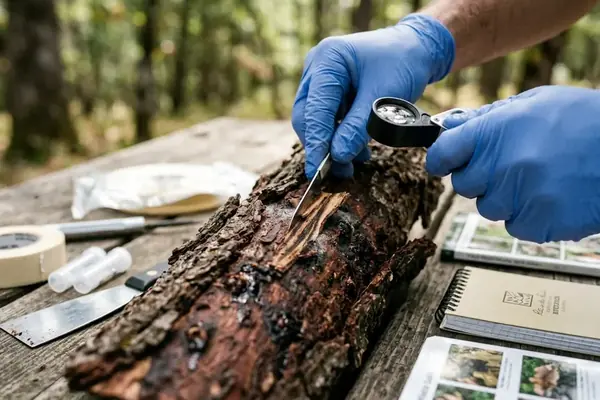
Tracking a pathogen across terrain this rugged demanded a hybrid of professional forestry and citizen science. SOD Blitz surveys anchored the effort: trained volunteers deployed in roughly four-to-six-week intervals from February through May, sampling symptomatic bay laurel foliage along established routes while foresters handled the technical confirmation and spatial mapping.
From broad treatment to surgical removal
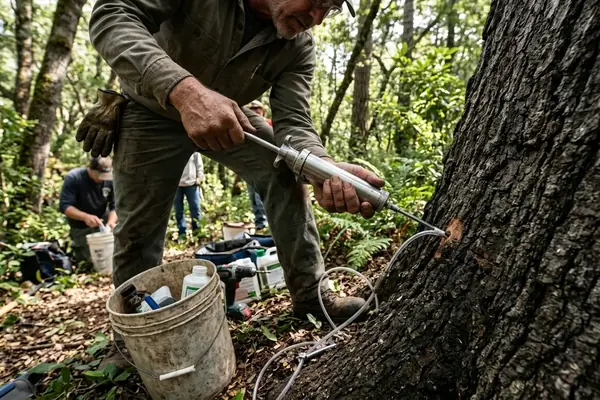
The management team's first instinct was ambitious — broad-spectrum phosphite trunk injections across every mature oak in the test plots. It lasted one season. The labor cost was prohibitive on this scale and this topography, and the crew shifted to something more disciplined.
The refined strategy centered on the bay laurel. Bay laurel is the pathogen's great amplifier: it carries heavy spore loads without dying itself, showering nearby oaks. So the protocol became selective. Crews cleared bay laurel within around a 10 to 15 meter radius around high-value oaks, paired with localized sanitation to keep tools and boots from carrying inoculum between sites.
- Confirm infected bay laurel through volunteer sampling and testing confirmation.
- Identify high-value oaks worth defending within each accessible grove.
- Remove bay laurel inside the clearance radius, prioritizing uphill and upwind stems.
- Apply sanitation between sites to prevent mechanical spread.
What the map could and couldn't reach
The partnership with local land trusts — sustained across the full ten-year period, opened gates and easements that would otherwise have been impossible to survey. That access mattered enormously.
It was not unlimited. One honest catch to this dataset: the extreme topography of the Big Sur watershed restricted monitoring to accessible trail corridors and ridgelines. The findings represent these specific edge-habitat ecological zones rather than the deep, inaccessible interior of the mountain range. What held on a monitored ridge may not describe a ravine no crew could safely enter.
The Results: Ecological Cascades and Canopy Survival
The contrast between managed and unmanaged zones sharpened year over year. In isolated groves where early bay laurel removal was executed, mature oak canopies held. LiDAR passes showed retained density where the surrounding matrix thinned. These were not sprawling victories — they were pockets, groves, defensible islands, but they were real, and they persisted.
Where the pathogen reached critical mass before anyone intervened, the picture was grim. The record here is blunt: widespread tanoak mortality in continuous, unmanaged stands where the pathogen reached critical mass before intervention could occur. Once infection took hold in those dense corridors, the timeline from initial tanoak infection to structural collapse ran a compressed roughly two to four years.
The cascade beneath the canopy
Around year five, researchers widened the survey protocols to include understory vegetation transects, moving past canopy metrics alone. The reason became clear in the data. As tanoaks fell and light flooded the newly opened gaps, the forest floor changed character. Shade-tolerant sword ferns gave way to sun-adapted invasive grasses.
That shift is more than cosmetic. A grass-dominated understory carries fire differently and offers different habitat than the fern layer it replaced. The death of the tanoak did not end at the tanoak; it rippled downward into the whole vertical structure of the woodland.
Warning: Canopy gaps are not neutral pauses in recovery. Left unmanaged, they invite invasive grass colonization that resists the return of native understory and alters fire behavior for years.
Next Steps: Applying the Big Sur Blueprint to Your Land
Big Sur was a watershed-scale effort, but its central lesson scales down cleanly to a single property. Early detection is the one factor that most changes the disease's course. Everything else — treatment, removal, sanitation — buys far less once the pathogen has saturated a stand.
Land management advisors built a triage protocol around this reality. It instructs owners to prioritize mapping bay laurels located uphill and upwind of mature oaks, because that is the path spores take in runoff and fog drift. A minimum about 5-meter buffer works for an initial residential baseline, expanding toward the 10 to 15 meter clearance radius used in the field plots for higher-value trees.
Pre-Season Sudden Oak Death Property Assessment
- Map all California bay laurels within close to 15 meters of mature oaks.
- Identify uphill bay laurels that could shed spores in runoff.
- Schedule bay laurel pruning or removal between August and October.
- Inspect oak trunks for bleeding cankers before the winter rains begin.
Timing is not incidental. The window for preventative clearing runs late August through October — the dry stretch when cutting bay laurel poses the lowest risk of spreading inoculum and gives wounds time to seal before spring sporulation resumes.
Do this now, before the next rainy season: walk your property and mark every California bay laurel standing uphill and upwind of an oak you want to keep. Measure the distance to each oak, flag anything inside the 15-meter zone, and put those stems on the calendar for removal this fall. That single map is your baseline — and it is the difference between defending a grove and documenting its loss.



Your Thoughts
No comments.
Leave a Comment